Free Access
Figure 2.
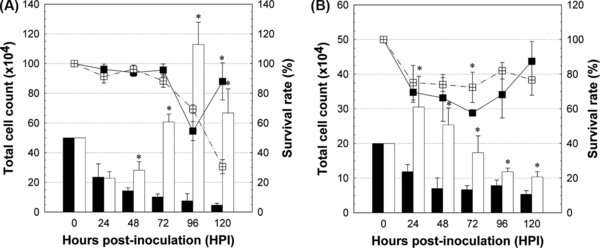
Changes in total cell counts and cell survival rate of mock- and porcine circovirus type 2 (PCV2)-inoculated porcine monocytes (Mo) (A) and monocyte-derived macrophages (MDM) (B) over time as determined by trypan blue dye exclusion assay. Data are shown as mean ± SD of 6 pigs from three independent experiments in triplicate. *The difference between PCV2- and mock-inoculated groups at the same hour post-inoculation (HPI) is statistically significant (p < 0.05). ■: total cell counts of mock-inoculated, □: total cell counts of PCV2-inoculated, –■–: cell survival rate of mock-inoculated, –□–: cell survival rate of PCV2-inoculated.