Open Access
Figure 3.
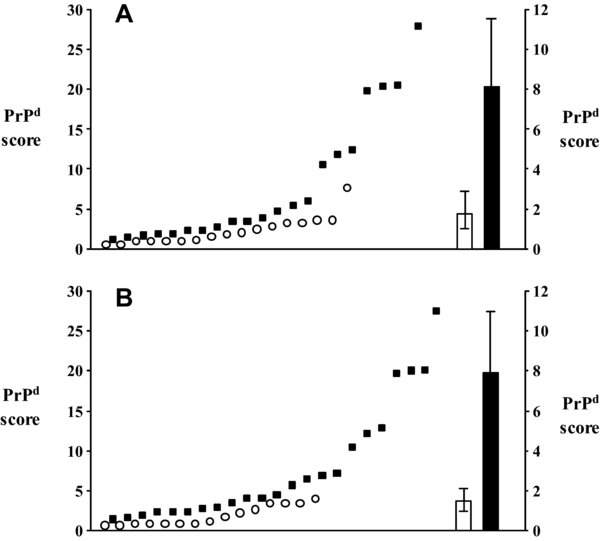
Individual brain PrPd scores (against left y-axis) and average brain PrPd values (against right y-axis; error bars, 95% CI) of goats that were negative (circles and open bar) or positive (squares and solid bar) in the ENS (A) and in the TSC (B).