Open Access
Figure 1.
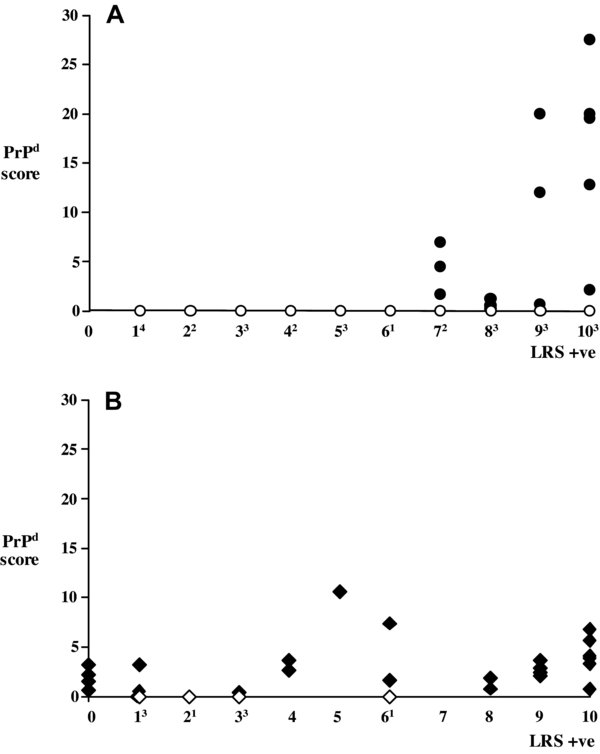
Magnitude of PrPd accumulation in the brain (y-axis; cumulative score of 10 areas examined) in relation to the number of LRS tissues affected (x-axis; superscripts refer to the number of brain-negative animals for each level of LRS positivity). (A) II142 goats; (B) IM/MM142 goats.