Figure 1.
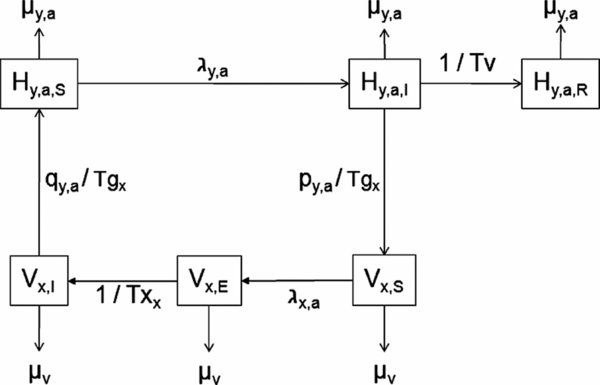
Structure of the metapopulation model. H y,a,z : proportion of birds in age class a, health state z of population y; V x,z : proportion of vectors living at location x that have the health state z; μ y,a : daily mortality rate of birds in age class a of population y; μ v : vector daily mortality rate; λ y,a : force of infection for hosts in age class a of population y; Tv: duration of viraemia in hosts; Tg x : duration of gonotrophic cycle in vectors living at location x; Tx x : duration of the extrinsic incubation period in vectors living at location incubation period in vectors living at location x; q y,a : proportion of bites that occur on birds of population y and age class a; and p y,a : proportion of viraemic birds in population y and age class a.