Figure 2.
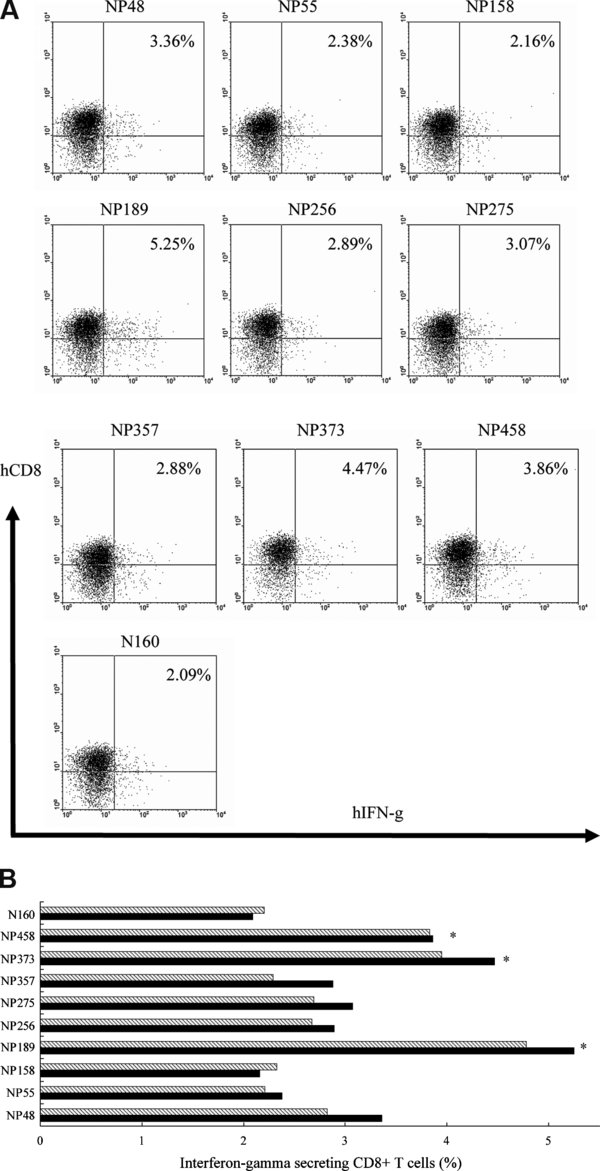
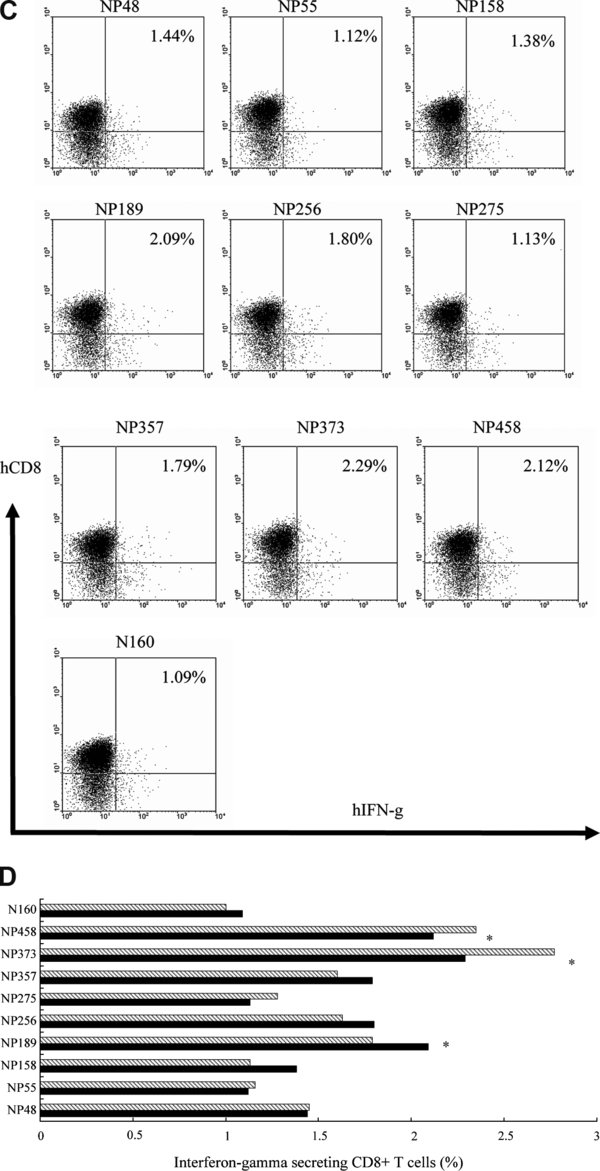
An illustration of intracellular cytokine staining due to the secretion of IFN-γ from human CD8+ T cells. CD8+ T cells were primed with autologous NP-loaded DC three times at 1-week intervals. Primed CD8+ T cells were cultured with different target peptide-loaded T2 cells for 8 h and the number of IFN-γ-secreting CD8+ T cells was stained with PE-conjugated anti-human CD8 and an FITC-conjugated anti-human IFN-γ antibodies, and subsequently subjected to flow cytometry. A negative control was set up using T2 cells added with previously identified non-responsive peptide (N160). (A) Representative data from flow cytometrical analysis of one of the two experiments performed for the first donor. (B) A graph showing the data from two individual experiments for the first donor only. (C) Representative data from flow cytometrical analysis of one of the two experiments performed for the second donor. (D) A graph showing the data from two individual experiments for the second donor only. The p values were calculated by the student’s t-test (*p < 0.05) on comparisons between sample data points and the negative control data point.