Figure 6.
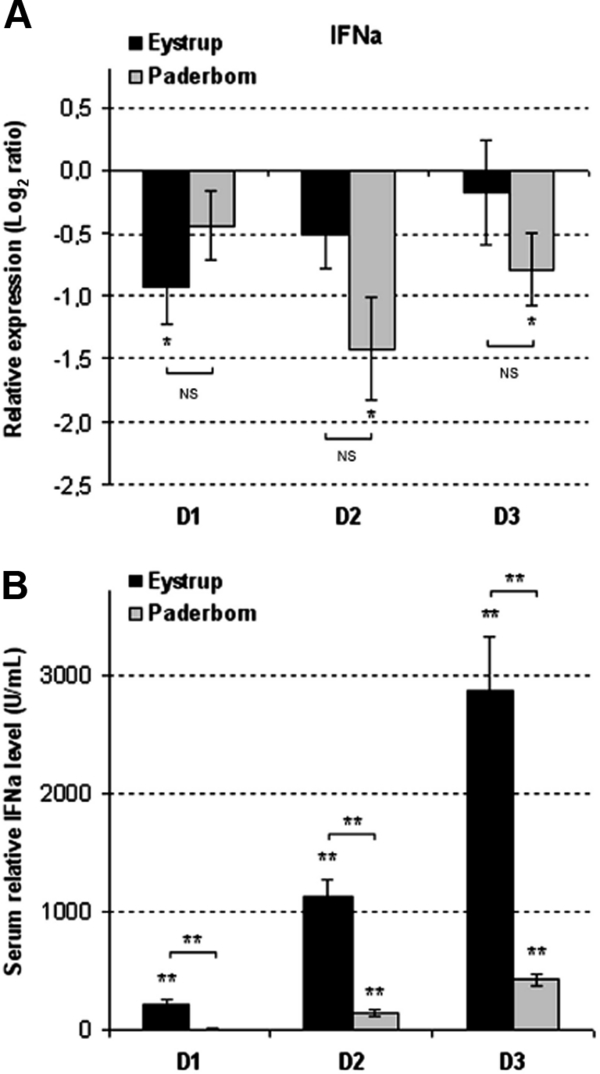
IFNa expression and production modulations in PBMC and sera induced by CSFV infection during the post-infection time-course. (A) IFNa expression assessed in PBMC by real-time RT-PCR. The presented values are the relative expression (Log2 Ratios) calculated from the CT results on D1, D2 and D3 pi in relation to D0 as described in Materials and methods. (B) IFNa levels in serum quantified by ELISA. The values are presented in relation to the levels quantified before infection. All data correspond to the mean (± SE) of results obtained for the 8 pigs infected by Eystrup or the 8 pigs infected by Paderborn. * p < 0.05 and ** p < 0.01 either compared each post-infection value with the respective D0 value using Paired Two-sample Student’s t-test, or Eystrup values with Paderborn values using Two-sample Student’s t-test at each infection time-point.