Figure 4.
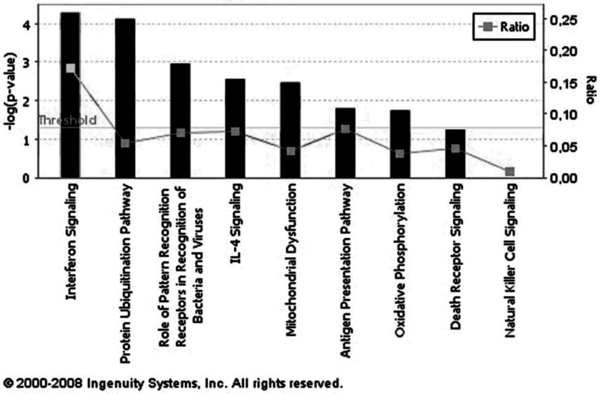
Signaling pathways distribution of genes differentially modulated by Eystrup in relation to Paderborn. Genes revealed by two-class SAM analysis over the 3 days post-infection were organized with the Ingenuity Pathway Analysis software according to the pathway in which they are involved in the current data base of this software, and classified according to the calculated –Log(p-values). The significance of the association between the data set and the signaling pathway was measured in two ways: ratio and p-value. Ratios refer to the proportion of variant genes from a pathway related to the number of genes included in the software database for this same pathway. The p-value, calculated using a right-tailed Fisher’s exact test, corresponds to the probability that the association between a set of focus genes and a given pathway is not due to random chance. The threshold corresponds to a limit of significance set by the software (p < 0.05). The first nine networks are shown.