Figure 2.
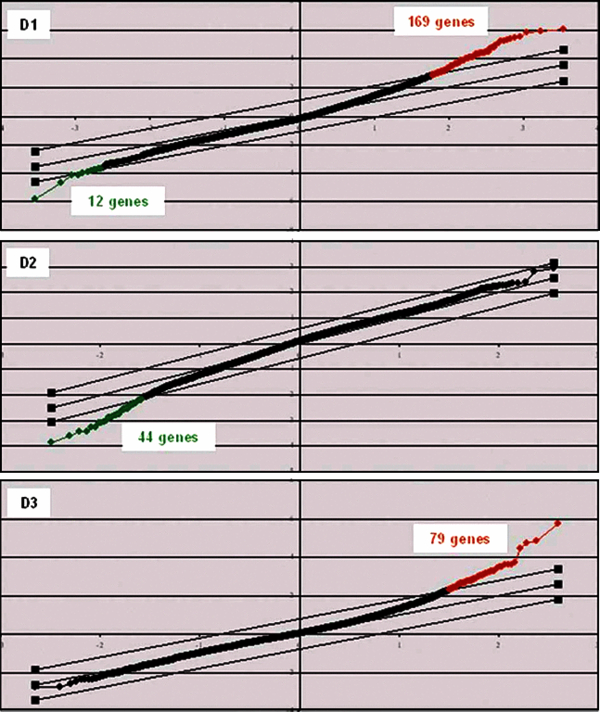
Two-class analysis SAM-plot of genes differently modulated by Eystrup in relation to Paderborn over 3 days post-infection. A two-class SAM analysis of microarray data was performed each day post-infection with the false discovery rate set at below 3%. In this analysis, gene expression in the 8 Eystrup samples was compared with gene expression in the 8 Paderborn samples. The x-axis values denote expected expression; y-axis values, observed expression; parallel transverse lines, threshold lines indicating a false discovery rate of < 3%. Red dots correspond to genes up-regulated by Eystrup in relation to Paderborn; black dots, invariant genes and green dots, down-regulated genes. (A color version of this figure is available online at www.vetres.org.)