Figure 2.
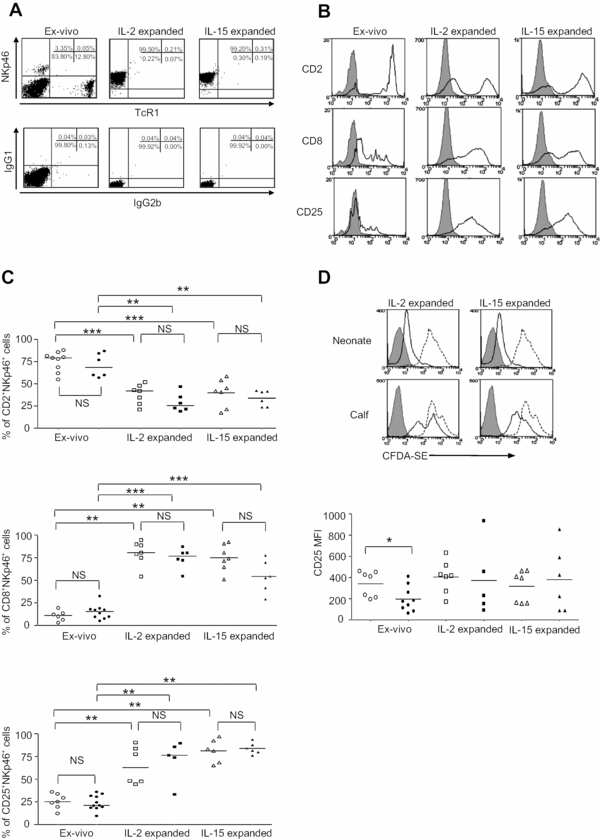
Phenotype and proliferation of peripheral blood NK cells from neonates and calves. (A) NK cells among PBMC defined as “Ex-vivo” and sorted NKp46+ cells cultured for 6 days in the presence of rbIL-2 (“IL-2 expanded”) or rhIL-15 (“IL-15 expanded”) were double labelled with antibodies against NKp46 and TcR1 or with appropriate isotypes. The proportions of cells relative to the total cells in the culture are given. Data shown are from one representative neonate. (B) NK cells among PBMC and sorted NKp46+ cells cultured for 6 days in the presence of rbIL-2 or rhIL-15 were double labelled with antibodies against NKp46 and one of the three markers, CD2, CD8 or CD25. Solid lines indicate CD2, CD8 or CD25 expression on NKp46+ cells, shaded areas correspond to isotype control mAbs. Data shown are from one animal representative of seven neonates. (C) The percentages of neonate (open symbols) and calf (filled symbols) NKp46+ cells expressing CD2, CD8 or CD25 were determined. Individual values and medians are presented. Statistical analyses were carried out with the nonparametric Mann–Whitney test. ** p < 0.01, *** p < 0.001, NS: Non significant. (D) NKp46+ cells from neonate and calf PBMC were sorted, labelled or not with CFDA-SE the day after isolation and expanded for 3 days with rbIL-2 or rhIL-15. The intensity of CFDA-SE labelling was determined by flow cytometry. The solid black line corresponds to dividing NK cells. The broken line shows NK cells cultured in the presence of rbIL-2 or rhIL-15 concentrations which allow minimal proliferation. The filled grey area shows unlabelled expanded NK cells. Data shown are from one animal representative of four. The MFI of the CD25 marker on neonate (open symbols) and calf (filled symbols) NKp46+ cells defined as in (A) and (B) were determined by flow cytometry. Statistical analyses were carried out with the nonparametric Mann–Whitney test. * p < 0.05.