Open Access
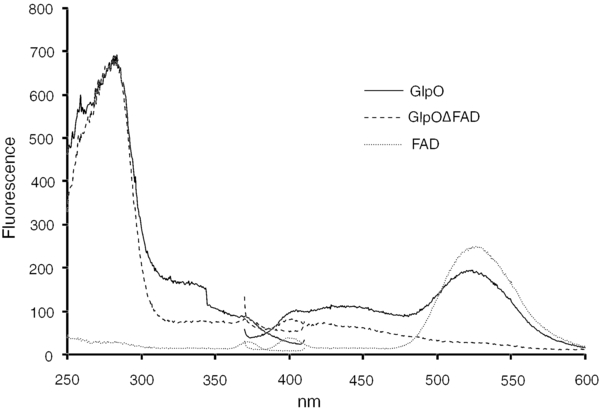
Figure 4.

Fluorescence excitation and emission spectra of GlpO, GlpOΔFAD and FAD. Spectra of GlpO (4.6 μM), GlpOΔFAD (1.2 μM) and FAD (7.7 μM) in 20 mM PBS were recorded. Excitation wavelength was 350 nm, and emission wavelength was 430 nm. Excitation spectra were measured at 250–410 nm; emission spectra were measured at 370–600 nm. The bold line represents the recombinant protein GlpO, the dashed line represents GlpOΔFAD and the dotted line represents free FAD.


