Free Access
Figure 4.
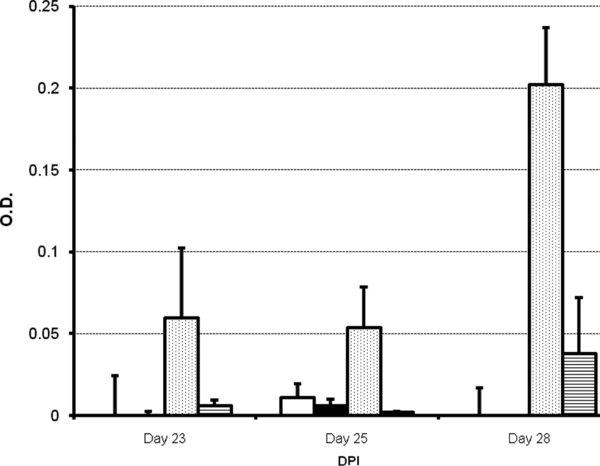
IgA and IgG antibodies in BAL. Influenza IgA and IgG anti-NP antibodies in BAL were analyzed by ELISA at day 23, 25 and 28 PI (corresponding to day 2, 4 and 7 after pH1N1 inoculation). White bars and dotted bars represent average IgA values of 2 and 4 animals belonging to Mock/Mock and Mock/pH1N1 groups, respectively. Black bars and lined bars represent average IgG values of 2 and 4 animals belonging to Mock/Mock and Mock/pH1N1 groups, respectively. Error bars represent one SD above and below the mean.