Free Access
Figure 1.
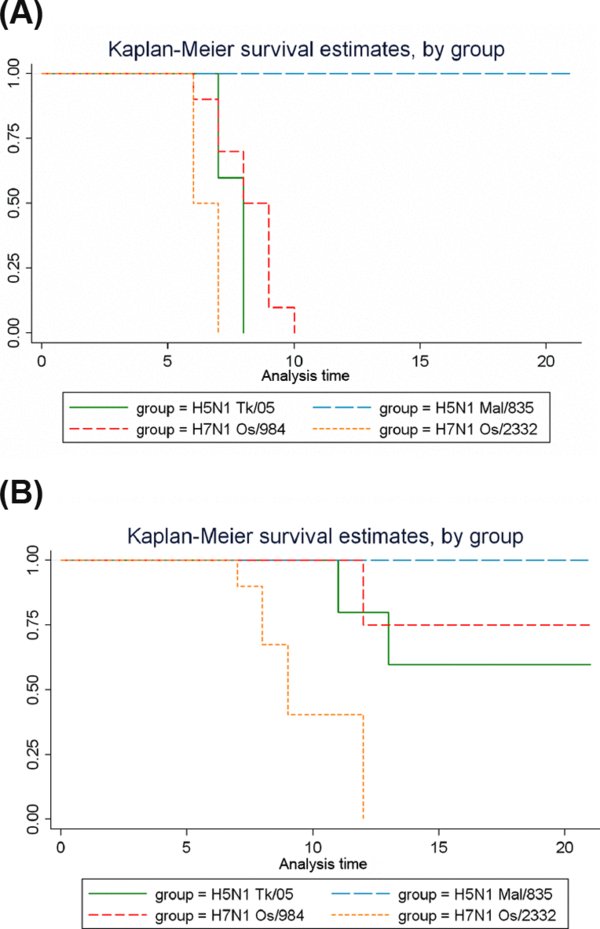
(A) Kaplan-Meier survival curve of infected mice (G1). Ten mice per group were intranasally infected with 10 LD50 of each virus. (B) Kaplan-Meyer survival curve of contact mice (G2). Time of death varied from day 7 to 10 p.i. for infected groups (A) and from day 7 to 12 p.c. for contact groups (B). While H5N1 Mal/835 infected and contact mice showed a 100% survival rate, all the other groups showed mortality rates ranging to 100% to 75%. (A color version of this figure is available online at www.vetres.org.)