Open Access
Figure 1.
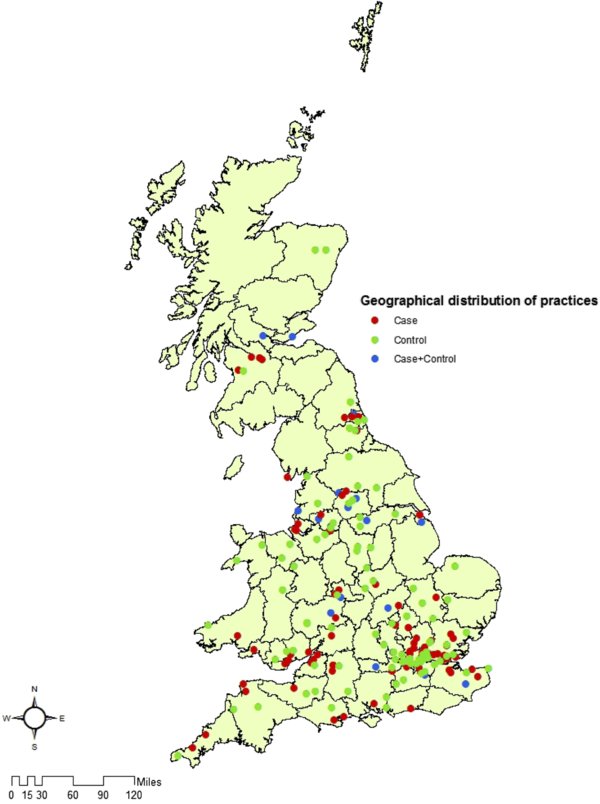
Geographical distribution of 150 practices enrolled in the study during October 2005 to October 2007 for which complete georeference information was retrieved. Practices contributing an MRSA case, an MSSA control or both are depicted as red (black), green (grey) and blue (dark) dots, respectively. (For a color version of this figure, please consult www.vetres.org.)