Free Access
Figure 1.
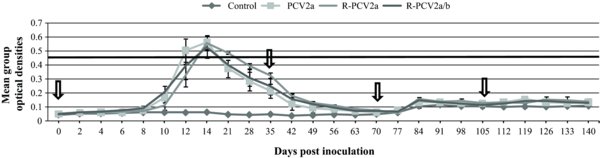
Mean group anti-PCV2 IgM response over time (± SE). Arrows indicate the timing of PCV2 inoculation in groups PCV2a, R-PCV2a and R-PCV2a/b and reinoculation in groups R-PCV2a and R-PCV2a/b. The line indicates the average plate cutoff values. Individual plate cutoff values were determined by multiplying the average O.D. value of the positive control well by 0.4 as recommended by the manufacturer.