Open Access
Figure 2.
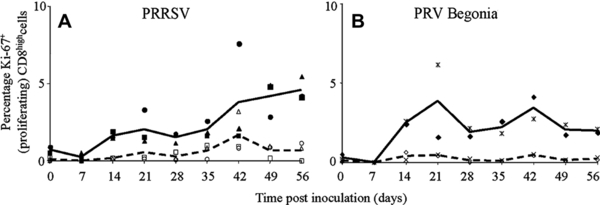
Time course of the percentage of proliferating CD8high cells in PBMC that were derived from virus-infected pigs and that were restimulated in vitro with virus or mock-control. A shows data for PRRSV-infected pigs; B for PRV Begonia-infected pigs. Full symbols represent individual pig values after restimulation with virus (■ pig 1, ● pig 2, ▲ pig 3, ♦ pig 4,  pig 5); empty symbols represent individual pig values after mock-restimulation (□ pig 1, O pig 2, ∆ pig 3, ◊ pig 4, x pig 5). Each symbol represents the mean of 3 repetitions in an individual pig; full lines represent average values for the pigs obtained after restimulation with virus; dashed lines represent average values for the pigs obtained after mock-restimulation.