Open Access
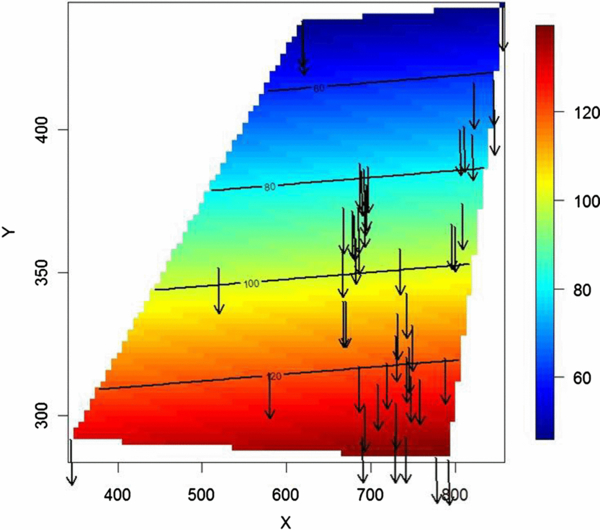
Figure 4.

Thin Plate Spline regression model for combined phases 1 and 2 of an epidemic of HPAI subtype H5N1 in Romanian poultry, 2005–2006. The color scale represents the interpolated outbreak day, with dark blue being the earliest outbreak day and dark red representing the final days of each phase. The arrows show the estimated direction and rate of spread, with longer arrows corresponding to a slower rate of spread. Note the unidirectional and relatively homogeneous rate in the pattern (north-south gradient) of spread shown by the arrows and underlying surface as the epidemic evolved across these two protracted epidemic phases.


