Open Access
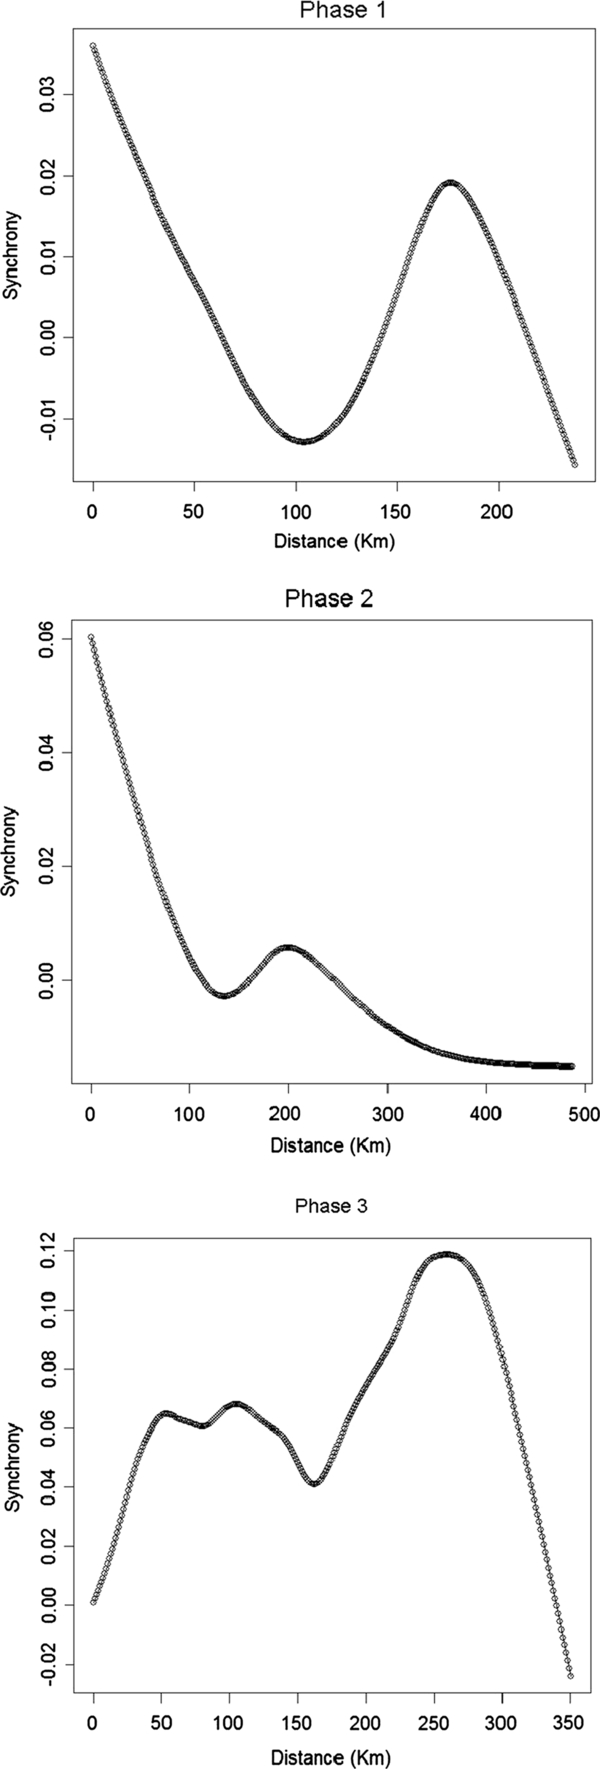
Figure 3.

Spatial synchrony, calculated using Equation (5), in each of three epidemic phases of HPAI subtype H5N1 outbreaks in Romanian poultry, 2005–2006. Non-parametric smoothing spline covariance functions were fit to outbreak data in each epidemic phase to compare patterns of synchrony. Synchrony is calculated by Equation (5). Phases 1 and 3 exhibit clear differences in the pattern of spatial synchrony and are hypothesized as having two different mechanisms of spread. The pattern of synchrony in phase 2 is very similar to phase 1.


