Open Access
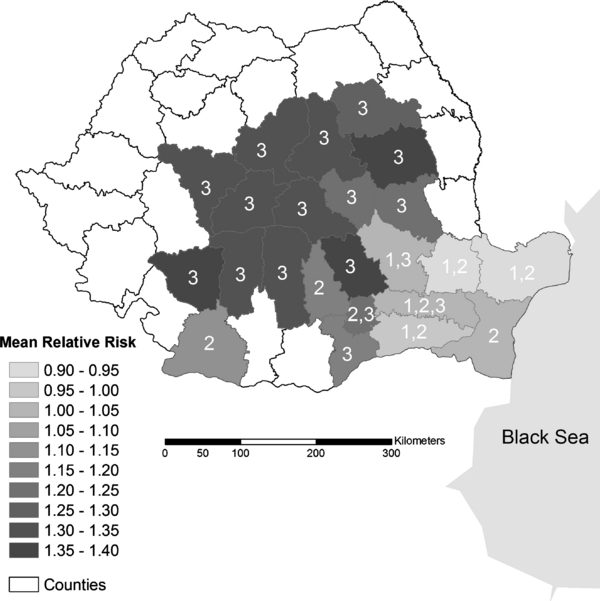
Figure 2.

Map of the posterior mean spatio-temporal relative risk of HPAI subtype H5N1 outbreaks from the best (Model 1) hierarchical Bayesian spatial Conditional Autoregressive Poisson model fit at the county scale of analysis. This component models the relative risk of an outbreak as the epidemic unfolds, with darker shades representing greater risk through time. Numbers in the figure indicate which epidemic phases were associated with each county, with some having more than one phase involved. Note the relatively limited and protracted spatio-temporal relative risk for counties associated with phases 1 and 2 of the outbreak, while the spatio-temporal interaction trend is wide spread and rapid across most counties associated with phase 3.


