Open Access
Figure 2.
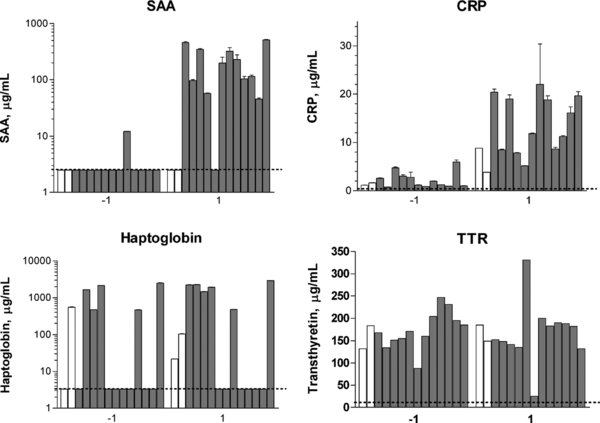
Serum concentrations in individual pigs of SAA, CRP, Hp and TTR before (−1 dpi) and after (1 dpi) inoculation with A. pleuropneumoniae. White bars represent uninfected controls (Nos. 23 and 24), and grey bars represent samples from inoculated animals (Nos. 25–36, depicted in numerical order). Detection limits are indicated by horizontal, dotted lines. Protein concentrations were determined by ELISA as described in the text. Mean and SD of two determinations are shown except for TTR (single determinations).