Open Access
Figure 1.
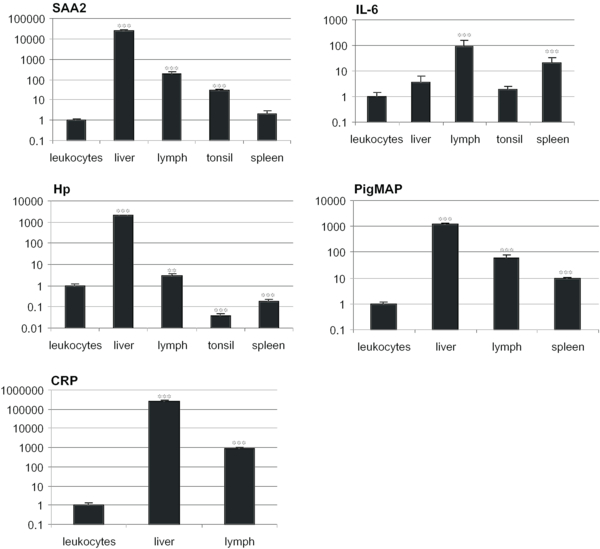
Analysis of gene expression changes of SAA2, Hp, CRP, IL-6, and PigMAP in different tissues in the group of infected animals (n = 10), compared to leukocyte expression values (set to 1). Standard error of the mean (SEM) is illustrated by error bars. Wilcoxon rank sum test was used to evaluate the significance of the tissue specific differences in gene expression compared to leukocytes. * p < 0.05, ** p < 0.01, *** p < 0.001.