Open Access
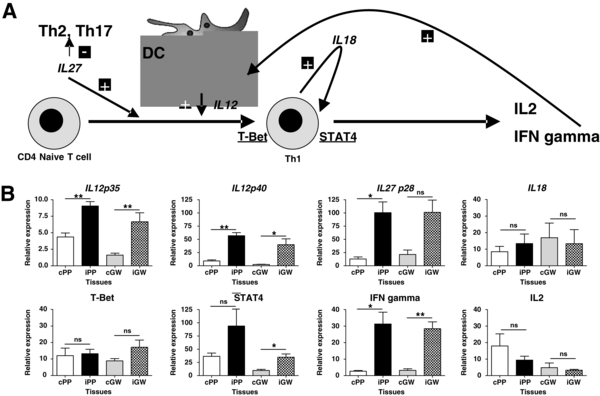
Figure 2.

(A) Schematic presentation of the T-helper type-1 (Th1) mediated immune response. (B) Relative mRNA expression of Th1 cytokines and transcription factors. Data were presented as mean ± S.E.M. for a total of 8 control and 12 infected loops. * P < 0.05, ** P < 0.01, ns: not significant (Student’s Paired t-test or Wilcoxon Signed Rank Test (Exact)). DC: Dendritic Cell; cPP: Control Peyer’s Patch (PP); iPP: Infected PP; cGW: Control Gut Wall (GW); iGW: Infected GW.


